It's been a while since our last Changelog post. We've been hard at work to push some bigger changes to the Cobalt platform. Check out some of the most recent improvements to the Insights tab:
RISK OVERVIEW CHART (Originally "Pentest Benchmark”) — Originally, the Pentest Benchmark chart was rich in data, but three-dimensional and hard to visualize. Now, the risk overview chart is simplified and converted into a time series to help customers understand how their asset risk is trending as well as how their assets compare with the Cobalt benchmark trend. When hovering over each data point, more information surrounding that given pentest is visible (e.g., number of findings, highest criticality of given finding, Cobalt Average for that year, etc.) If the user has access to that given pentest and wishes to see more details, they will be able to click on the point and be redirected to the pentest summary page.
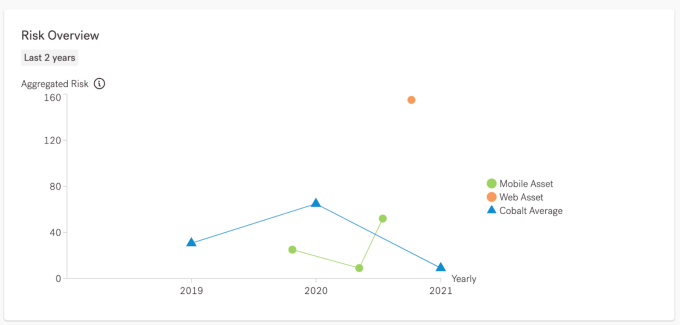
Users can view an asset’s risk over time and hover over each data point for more information about each pentest
ALL FINDINGS CHART (Originally "Open Findings By Criticality”) — The Open Findings By Criticality chart has been renamed and now includes more finding states that were originally left out — “Accepted Risk” and “Carried Over.”
TIME FILTERS — The Insights page now allows filtering by time. The filters help to slice data based on the timeframe of tests users want to review or analyze. Customers can choose preselected date ranges or select their own dates from the calendar. These dates will persist on page refresh.
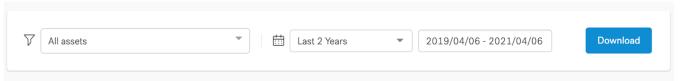
Time filters can be found at the top of the Insights page next to the asset dropdown
TOP CARDS — Top cards have been improved to accurately reflect only relevant data and give a complete picture of what has occurred for selected asset(s) during a specified period of time.