Make sure to check out our Integrations page for more info!
Last time we talked about how to import data into Google spreadsheets. This time let’s focus on something more powerful — Google Data Studio — and learn how to build more sophisticated versions of the dashboard. To learn more about the Cobalt API and how to use it, please check the first article from this series, Cobalt Launches Public API to Further Modernize Pentesting.
Why Google Data Studio?
Compared to Google Sheets, Google Data Studio allows you to perform a more detailed analysis. You will be able to create highly customizable reports ready to share with whoever you like to. However, the setup process looks a little different than our previous tutorial. For example, Google Data Studio requires us to define data sources. For this example I will show you how to export any data from Cobalt into a CSV file, which later can be used with Data Studio.
Data Preparations & Export
If you read the previous article, you probably already have your tokens prepared. If not, please check out the instructions I’ve listed there. After you have generated Auth Token, as well as Org Token, you can start following this tutorial.
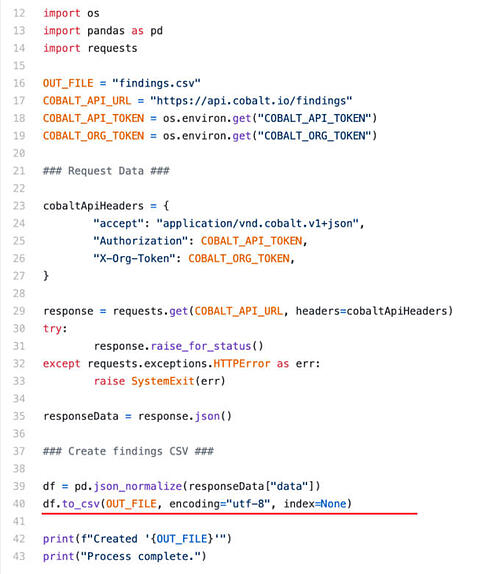
Let’s start creating a format that can be imported into Google Data Studio. As already mentioned, the simplest way would be to create a CSV with all necessary fields. To create it we will use a simple Python script. This script will let us download all of the findings into a single CSV file.
I encourage you to play with the script and add scoping in case you want to download findings only from one asset or pentest.
Side Note: Always export only data necessary for your analysis. You can achieve this by adding a list of columns to the export function in line 40th. For example:
df.to_csv(OUT_FILE, encoding="utf-8", index=None, columns=['resource.title', 'resource.labels','resource.impact','resource.likelihood'])
To run this script make sure you have Pandas installed which you can set up by running pip command in your console: pip install pandas
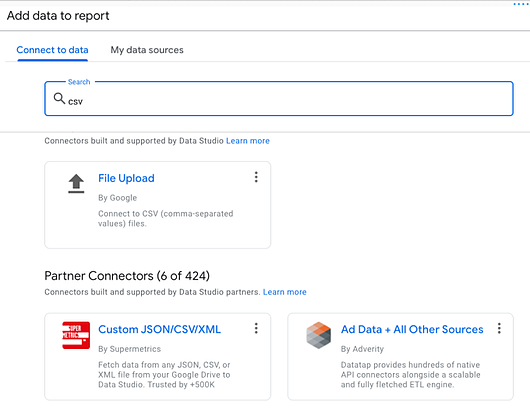
As soon as you run the script it will create the file findings.csv. You can then upload it to Google Data Studio as seen on the screenshot.
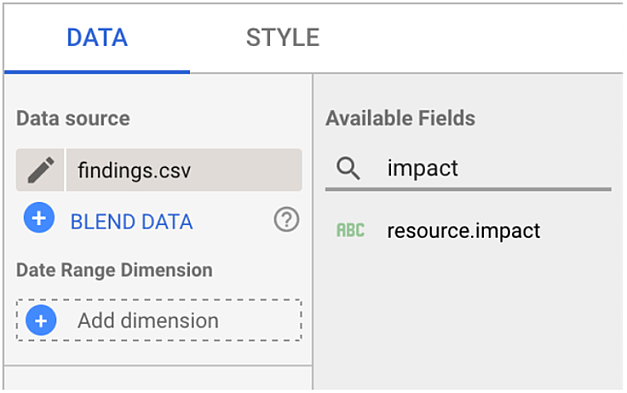
Using data from findings.csv we can now create all widgets as visible from the screenshot below.
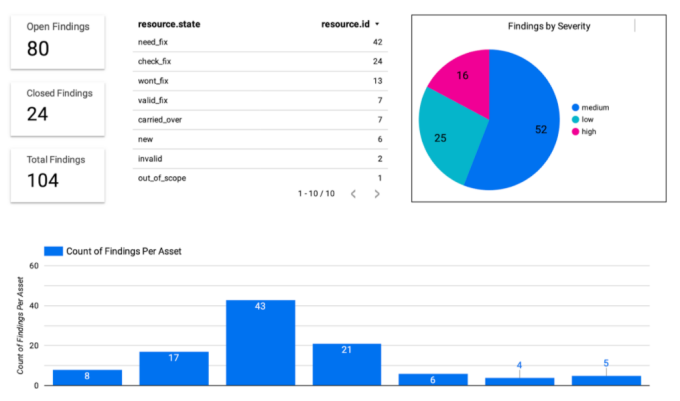
I encourage you to experiment with different graph styles to find the visualizations that work best for you and your reporting needs. The end result might look like the this:
As you can see, using the Cobalt API is really simple. With basic Python knowledge, you can parse and export your data to any tool you’re interested in.
Explore more integrations available on Cobalt's Pentest as a Service (PtaaS) platform. As always if you have any questions or want to tell us about an interesting use case for the Cobalt API, please reach out to us at integrations@cobalt.io.